update May 2024: See the new version of this tutorial
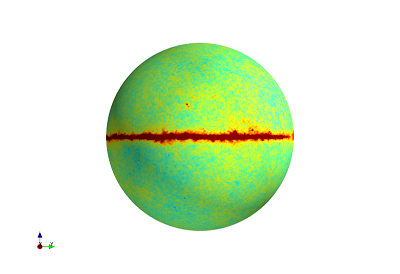
Mayavi is a Python package from Enthought for 3D visualization, here a simple example of creating a 3D interactive map starting from a HEALPix pixelization sky map:Here the code:
This file contains hidden or bidirectional Unicode text that may be interpreted or compiled differently than what appears below. To review, open the file in an editor that reveals hidden Unicode characters.
Learn more about bidirectional Unicode characters
| from mayavi import mlab | |
| import numpy as np | |
| import healpy as hp | |
| # load a WMAP map | |
| m = hp.read_map("data/wmap_band_iqumap_r9_7yr_W_v4.fits", 0) * 1e3 # muK | |
| nside = hp.npix2nside(len(m)) | |
| vmin = -1e3; vmax = 1e3 | |
| # size of the grid | |
| xsize = ysize = 1000 | |
| theta = np.linspace(np.pi, 0, ysize) | |
| phi = np.linspace(-np.pi, np.pi, xsize) | |
| longitude = np.radians(np.linspace(-180, 180, xsize)) | |
| latitude = np.radians(np.linspace(-90, 90, ysize)) | |
| # project the map to a rectangular matrix xsize x ysize | |
| PHI, THETA = np.meshgrid(phi, theta) | |
| grid_pix = hp.ang2pix(nside, THETA, PHI) | |
| grid_map = m[grid_pix] | |
| # Create a sphere | |
| r = 0.3 | |
| x = r*np.sin(THETA)*np.cos(PHI) | |
| y = r*np.sin(THETA)*np.sin(PHI) | |
| z = r*np.cos(THETA) | |
| mlab.figure(1, bgcolor=(1, 1, 1), fgcolor=(0, 0, 0), size=(400, 300)) | |
| mlab.clf() | |
| mlab.mesh(x, y, z, scalars=grid_map, colormap="jet", vmin=vmin, vmax=vmax) |
The output is a beautiful 3D interactive map, Mayavi allows to pan, zoom and rotate.
UPDATE 13 Mar: actually there was a bug (found by Marius Millea) in the script, there is no problem in the projection!
