import healpy as hp
import numpy as np
%matplotlib inline
import matplotlib.pyplot as plt
import astropy.units as u
In this series of notebooks, we will understand how to handle white noise in the case of an experiment with sky observations which are both not-uniform and have partial sky coverage.
Let’s first start assuming a sensitivity of an experiment array of detectors of
# Number based on Simons Observatory SAT UHF1 array of detectors

net = 10. * u.Unit("uK * sqrt(s)")
5 years with a efficiency of 20%:
integration_time_total = 5 * u.year * .2Uniform full sky survey
As a reference, let’s first start with the trivial case of uniform full sky coverage, i.e. we spend the same amount of observation time in each pixel.
nside = 512
npix = hp.nside2npix(nside)
standard_deviation_per_pixel = (net / np.sqrt(integration_time_total/npix)).decompose()standard_deviation_per_pixelm = np.random.normal(scale = standard_deviation_per_pixel.value, size=npix) * standard_deviation_per_pixel.unitm = m.to(u.uK)hp.mollview(m, unit=m.unit, title="White noise map")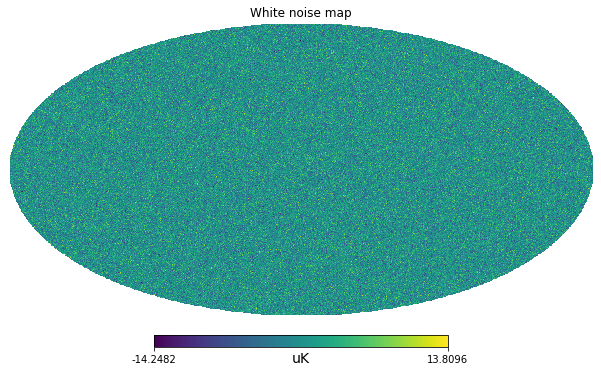
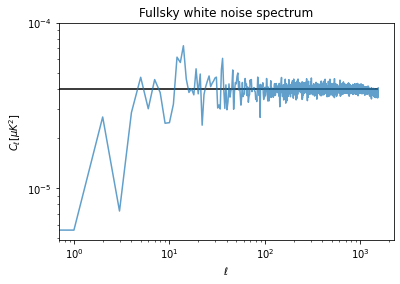
Power spectrum
Finally we can compute the angular power spectrum with anafast, i.e. the power as a function of the angular scales, from low
At low
Where:
cl = hp.anafast(m)cl[100:].mean()3.9283892627207396e-05m.std()pixel_area = hp.nside2pixarea(nside)white_noise_cl = (standard_deviation_per_pixel**2 * pixel_area).to(u.uK**2)white_noise_clplt.figure(figsize=(6,4))
plt.loglog(cl, label="Map power spectrum", alpha=.7)
plt.hlines(white_noise_cl.value, 0, len(cl), label="White noise level")
plt.title("Fullsky white noise spectrum")
plt.xlabel("$\ell$")
plt.ylabel("$C_\ell [\mu K ^ 2]$");